GEN 2 One List - Tuner comparisons...

Who's Tune Are you Running?

  • MPT (morepowertuning)

    Votes: 29 43.9%
  • 5-Star

    Votes: 6 9.1%
  • Livernois Motorsports

    Votes: 3 4.5%
  • Whipple

    Votes: 18 27.3%
  • AFe Scorcher

    Votes: 3 4.5%
  • Other

    Votes: 7 10.6%

  • Total voters
    66

Disclaimer: Links on this page pointing to Amazon, eBay and other sites may include affiliate code. If you click them and make a purchase, we may earn a small commission.

Guy

FRF Supporting Member
Supporting Member
Joined
Feb 16, 2017
Posts
1,781
Reaction score
1,124
Whipple is handcuffed by emissions standards and Ford who I think are ultimately going to relabel it as the FOMOCO tune when it makes it thru all the CARB testing. It’s not a bad tune. It’s safe and reliable, but mild.

5 Star early on made some goofy claims that they picked up horsepower at 3000 miles and started the rumor that the truck picked up juice on its own. Since proven false.... their dyno runs are even more inflated than Hennessey. You do that math.

MPT and Livernois are very similar, but Livernois pulls the A/F ratio, timing, boost in the upper RPM range for safety and reliability... so you can run one tune and throw on a trailer... it’s similar to the MPT tow tune. The ecoboost platform is prone to knock under load. With Livernois you don’t get transmission upgrades yet.

The add on chips are what they are.


It is why I’ve said it from day one... MPT is one heck of a tune.


Its always fun to compare dyno charts because there are so many ways to make them look the way the person wants them to for the internet viewers.

Lets be honest, most people arent pushing the skinny pedal down to WFO at every stop light so peak numbers are just that, there very most peak. I like to look at when power comes in at and compare them to see who brings the power on sooner and holds the power across the rpms vs a graph that looks like the letter n. With that being said id have to call BS on 5*s graph because its so far off of the others its not even believeable.

Although the graphs look so different from one another, take a look at all of them @3500RPMS. There identical!!

MPT 300HP/450TQ
Livernois 300HP/450TQ
AFE 300HP/450TQ
Superchips 295HP/440TQ
5* 435HP/560TQ
Whipple 240HP/350TQ
JMS RPMS Not Listed


I highlighted 5* & Whipple because the 5* is just so far from believeable im tossing it out and the Whipple is just to low to compare. JMS listed MPH vs RPMS so i could get the numbers off there chart.

Wayne
 

Digger

Full Access Member
Joined
Mar 8, 2012
Posts
298
Reaction score
212
Location
Oxford, Ma
I see that SCT finally has tunes available. I used them with my 12 Raptor and was very happy with their tunes. The dyno charts look very impressive and perhaps a bit too impressive. Has anyone on here tried them on a Gen2 yet?
 
Last edited:
OP
OP
Toadster

Toadster

FRF Addict
Joined
Jul 15, 2016
Posts
1,488
Reaction score
669
Location
Folsom, CA
love the conversation guys... i do see the torque curves looking very different across tuners...
 

Sitdown

FRF Supporting Member
Supporting Member
Joined
Oct 28, 2012
Posts
1,617
Reaction score
1,521
Location
Suburbia, IL
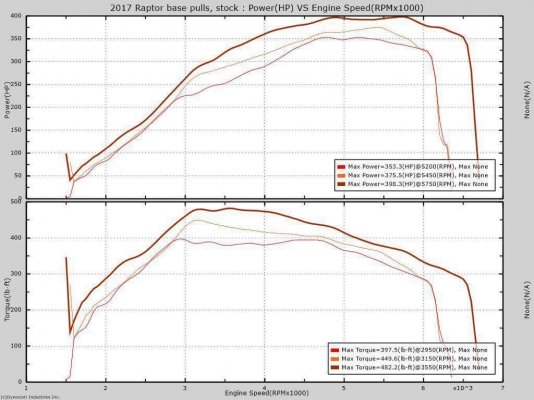
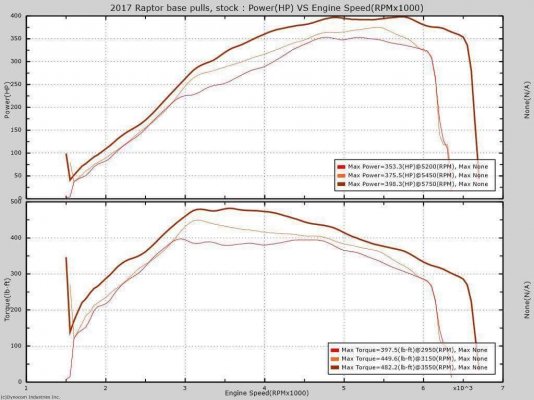
Thanks for corralling the data. Got charts from the truck that did stock (RED), 5star 93perf (ORANGE), and MPT 93PRX (BROWN). All done on the same dyno using 5th gear. I did see one pull with higher torque on the mpt, but at least this shows them all on one sheet.

Stock to 5 star 93Perf.... : +22rwhp +52rwtq
Stock to MPT 93PRX...... : +45rwhp +85rwhp

81B374B0-03E9-4F1F-B5DF-63015CDD8007_zps9zlroavl.jpg
 
OP
OP
Toadster

Toadster

FRF Addict
Joined
Jul 15, 2016
Posts
1,488
Reaction score
669
Location
Folsom, CA
Thanks for corralling the data. Got charts from the truck that did stock (RED), 5star 93perf (ORANGE), and MPT 93PRX (BROWN). All done on the same dyno using 5th gear. I did see one pull with higher torque on the mpt, but at least this shows them all on one sheet.

Stock to 5 star 93Perf.... : +22rwhp +52rwtq
Stock to MPT 93PRX...... : +45rwhp +85rwhp

81B374B0-03E9-4F1F-B5DF-63015CDD8007_zps9zlroavl.jpg

those curves are CRAZY different!!!
 

Guy

FRF Supporting Member
Supporting Member
Joined
Feb 16, 2017
Posts
1,781
Reaction score
1,124
No contest.

All dynos are calibrated a little different, but I believe these curves are 35 horsepower low. 5 star comes in around 60 usually and MPT around 85-90.

So many factors though


those curves are CRAZY different!!!
 

Sitdown

FRF Supporting Member
Supporting Member
Joined
Oct 28, 2012
Posts
1,617
Reaction score
1,521
Location
Suburbia, IL
correct so many variables, have to take each graph you see with grain of salt and average out all the consistent data you see. Even on the same dyno, same operator, gearing, etc.. overlaying charts also become skewed by enter/exit rpms, conditions and so on.

This particular dyno is consistently lower than most dynojets
 

smurfslayer

Be vewwy, vewwy quiet. We’re hunting sasquatch77
Joined
Dec 16, 2016
Posts
17,697
Reaction score
27,310
No contest.

All dynos are calibrated a little different, but I believe these curves are 35 horsepower low. 5 star comes in around 60 usually and MPT around 85-90.

So many factors though

don’t get too obsessed with the numbers themselves, as YMMV. That said, these all being done on the same dyno does tend to minimize the number of variables and gives us some sort of comparable data. Obviously, you can’t account for changing conditions, different trucks, etc. but it’s still good baseline data or at least a reference point.
 
Top